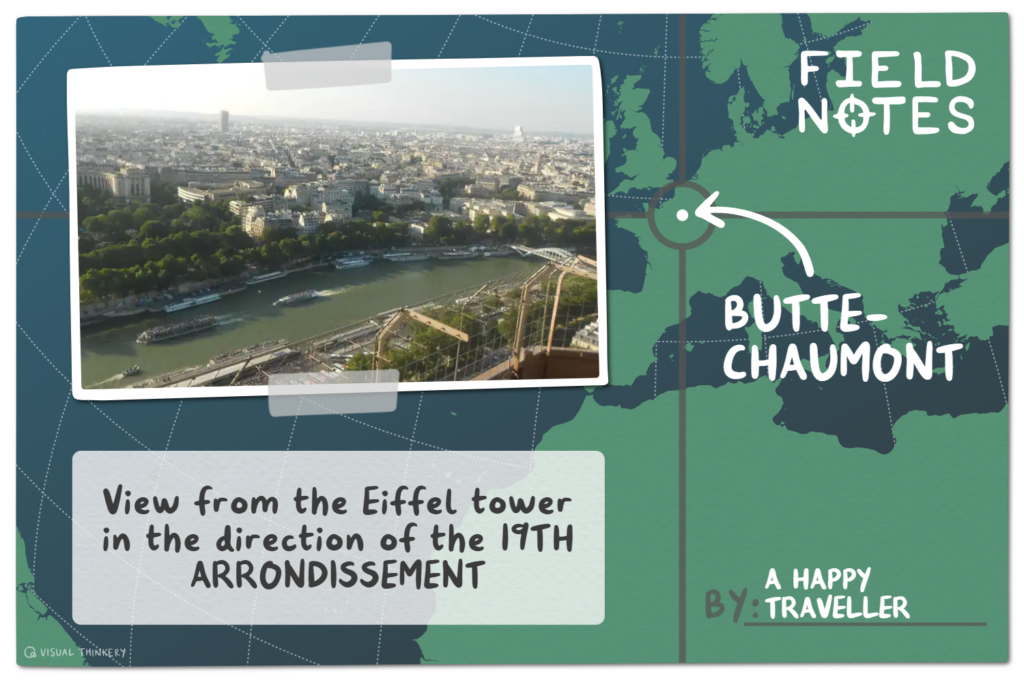
The third post is about maps personal cartography and my (fr) “géomatique” attempts with geodata. I’ll explore a data centred “map”, generated “automatically” with spatial data infrastructure.
Instead of a “normal” hand drawn map (see the map of the 19th arrondissement of Paris below), or a map with a particular boundary with labels (see the Parc de la Villette map on Codepen and the corresponding 19th Arrondissement.geojson on Github). I’ll generate an Arts Festival query and compare Arts festivals in two countries and make it possible to download available information.
Firstly – how many ARTs Festivals are on Wikidata? Look at https://w.wiki/MHP7 or visit query.wikidata.org. You’ll see instructions to answer the question. “Count the instances (P31) of arts festivals (Q4801521)”.
title: Number of Arts Festivals on Wikidata
SELECT (COUNT(*) AS ?count)
WHERE {
?item wdt:P31/wdt:P279*   wd:Q4801521
}
The answer to this numbers question will vary as it depends on the available data and how well I constructed the query.
Resources Used
Sites like Geojson / Wikidata / Wikimedia Commons /Leaflet/ SPARQL/ Overpass Turbo offer access to openly licensed data, which allowes me to remix and re-use materials under stated conditions. I can combine these resources, to make layers of information visible. Sounds complicated? Yup! Demonstrable? I think so. Can others do this. Absolutely Yes! Please feel free to copy and paste.
Disclosure: I used chat GPT
Paris and Clarens

I am off to Paris in July on a scholarship. As part of my preparation, I have been looking at Parisian maps and plotting out places / events that I want to visit /attend. There’s Bastille Day on the 14th (I’ll just miss that one) and the Paris-Plages (how cool, fake beaches on the Seine).
I’’m not only mapping small parts of Paris. The Clarens Arts Festival is on Wikipedia and I made a key locations map for Nicola Martins.
With my data driven spatial specs on, I’m going to make an arts festivals map. I’ll show you how to….
- make a map base layer which will contain markers to arts festival locations in South Africa and in France
- position the festivals and each location on the base layer map. When clicked, a label will appear with a corresponding image (if it exists). Each festival will have a Wikidata number (for update purposes).
- build the base layer map and marker on Leaflet and on a table. Data will be supplied by an openly licensed GeoJSON file generated by the SPARQL and formatted for the chart.
Wikidata, Commons, Wikipedia and OpenStreetmaps have been extremely useful as resources. They often contain co-ordinates, included map modules, OSM templates that pull in openstreetmap data or geoshapes (P3896). These worked exemplars have permitted me see how map shapes are generated and stored as points, lines or polygons. I’ve also started a collection of GeoJSON files on GitHub. Yes, Chat GPT, Leaflet and CodePen have shown how a static GeoJSON file can be turned into a visual. You can do the same (and change the parameters quickly using SPARQL). The generated file could then be archived on Wikimedia commons, built into the map itself, or uploaded as a raw file to GitHub or be included in a spreadsheet. These GeoJSON files can also be generated by using https://overpass-turbo.eu/ I’m very sure that there are more options. Its always helpful to have plan B.

Beads and baskets and SPARQL
So, we are exploring some abstract concepts. To help me pull vague abstractions together into a clear explanation, I like think about something physical and concrete. Instead of festivals, I’ll use beads and think about “trays”, “baskets” and “weaves”. You might have to think of your own.
Why physical and concrete? Let’s use another abstract concept. Time! By itself, time is hard to imagine. When you picture a clock with numbers, long and short hands, a clock face and a seconds hand ticking loudly as it passes these numbers. Then time’s passage becomes easier to notice and comprehend.
Querying SPARQL is also quite vague. So I’d like you to imagine you have scooped up some pretty beads and sorted them by colour. You need to store these beads somewhere, so you pop them into different baskets. Now assume that you have a range of beads and baskets. It gets quite difficult to remember which basket you placed which colour beads in. So you give the basket a label which links these basket and the beads in your mind. Now lets also assume that beads represent different things. Status, wealth, spiritual values. The basket label becomes is a “memory location” and the beads therein are arranged and categorized around that memory location. Now lets say that beads are not only about colours. Beads could also a way of communicating emotions in different languages. Our basket labels become more complicated. There are more variables introduced, or “memory locations” and the beads (when seen in relation to other beads) hold multiple meanings.
A Query Service called SPARQL allows me to locate beads (stored entities ) in baskets (memory locations). These beads and baskets are on Wikidata (a sister project of Wikipedia) and I can combine them in different permuatations . In this case SPARQL is going to help us identify Arts Festivals in South Africa and in Arts Festivals France. Each SPARQL query is an instruction. Go into a room that contain a wide mixture and assortment of beads. Use the baskets and sorting trays. Press play to execute a query and extract the desired beads from identified baskets. Then fill a tray with a particular collection of those beads.
After that, you will string the beads together and attempt to make meaning. Drawn from matching colours or perhaps it through a Zulu love letter. The meaning could be stitched into a an image grid, a map or a graph.
Making sense of variables
- Image grid of pictures of SA Art festivals.
- SA Arts festival plotted on a map
- Arts festivals compared on a world map
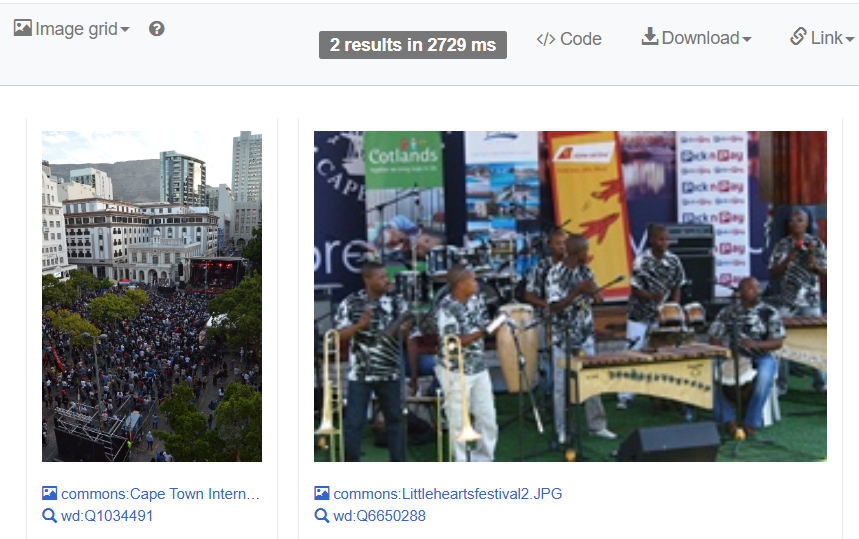
Guide for SPARQLing : Collect arts festival beads from the basket South Africa (P258 is the memory location) . Then string festival beads together as a grid of images (and not a necklace). These arts festival (Q4801521) orbs must be local and located in South Africa (Q258). You will display the workings of your search in a tray.
Eventually a collection of pictures of arts festivals from South Africa that are on Wikidata should emerge. Go to the Wikidata Query Service and paste this SPARQL in.
#defaultView:ImageGrid (my beads strung together)

SELECT ?beads ?beadsLabel ?beadsPic
WHERE
{ #baskets trays and beads
  ?beads   wdt:P31/wdt:P279* wd:Q4801521.
  ?beads   wdt:P17 wd:Q258.
  ?beads   wdt:P18 ?beadsPic.
}
Look in the tray. I am a little surprised by I have found. Only two arts festivals here in SA? Nope. There are only two South African arts festivals with pictures. Notice there is also other information, some which can be downloaded.
SA Arts festivals plotted on a map
Guide for SPARQLing: Collect beads/items called Q4801521 (arts festivals) in a labelled tray. The selected beads/item must have an associated geo location (P625) and then weave / plot both the festival and geo location on a map once you press play (https://w.wiki/M8GS)
#defaultView:Map

SELECT ?item ?itemLabel ?itemGeo
WHERE
{
  ?item wdt:P31/wdt:P279* wd:Q4801521.
  ?item wdt:P625 ?itemGeo.

SERVICE wikibase:label { bd:serviceParam wikibase:language "[AUTO_LANGUAGE],en". }
}
Now look at the results. You will see that there are arts festivals on the map from all over the world.
Experiment and play: What differences can you see between the above two queries? Hint: I switched a few words.
Arts festivals (compared) in four countries.
Guide for code: Collect the beads labelled arts festival (Q4801521) from two baskets labelled country South Africa (Q258), France (Q142), Canada (Q16) and….(you decide). Use the geographic coordinates basket (P625) to sort them them out by location and then display the name of the festival and the country. Optional : display the image and festival URL. https://w.wiki/FJfu

Select DISTINCT ?item ?itemLabel ?itemCountry ?itemGeo ?itemPic
where { ?item wdt:P31/wdt:P279* wd:Q4801521;
wdt:P625 ?itemGeo;
wdt:P17 ?itemCountry .
VALUES ?itemCountry {wd:Q258 wd:Q142 wd:Q16}
OPTIONAL {?item wdt:P18 ?itemPic .}
SERVICE wikibase:label { bd:serviceParam wikibase:language "en" }
}
If you have followed thus far, well done. This has been hard to write. It also might be hard to read and understand. Babbling is how we learn a new language.
A recap. I used SPARQL to
- make an image grid of pictures from festivals.
- plot out festival locations on a map.
- compare arts festivals in two, three or four countries (with images and a URL).
These three queries might leaving you asking WHY? You have not found many arts festivals. Well, that’s because Countries have a geomatician deficit. We need to be exploring geospatial technology. To be making our own streetmaps. By hand, or on Wikipedia or with GeoJSON.
Wikipedia and Wikidata frequently refer to maps / geodata. We can use a GeoJSON file for creating layers above our basemap. If you do mapping, you’ll find that GIS software is compatible with GeoJSON. You’ll also find it useful to know how to add co-ordinates to Wikidata?
Data meets the map of Paris
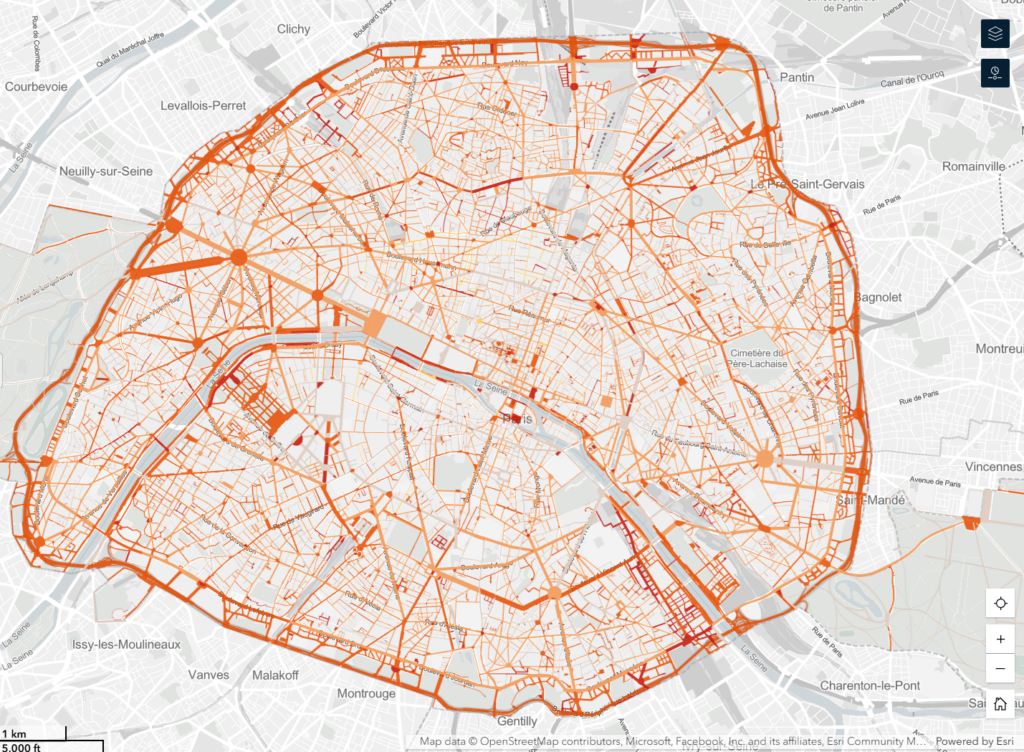
My first Paris map in this post was a hand drawn map of the 19th arrondissement. My second was a vector based map of all of Paris’s arrondissement’s . A SPARQL query (see below) shows the different points in the 19th arrondissement. If you insert #defaultView:Map and run this query, you will see a collection of Wikidata points.
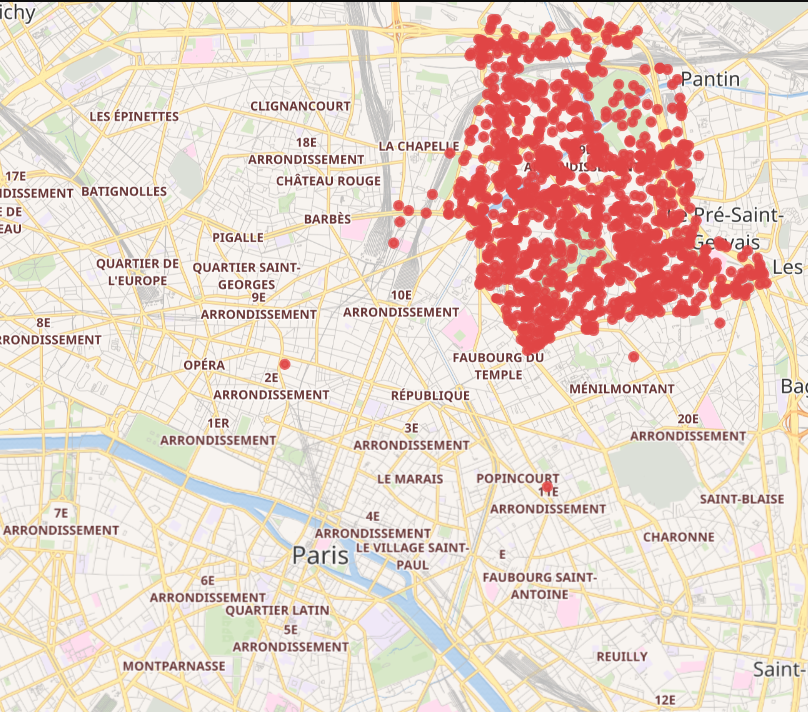
SELECT ?arrondissement ?arrondissementLabel ?coord ?geo
WHERE {
?arrondissement wdt:P131/wdt:P279* wd:Q204622; #// 19th arrondisimont of Paris
OPTIONAL { ?arrondissement wdt:P625 ?coord }
OPTIONAL { ?arrondissement wdt:P3896 ?geo.}SERVICE wikibase:label { bd:serviceParam wikibase:language "fr,en". }}
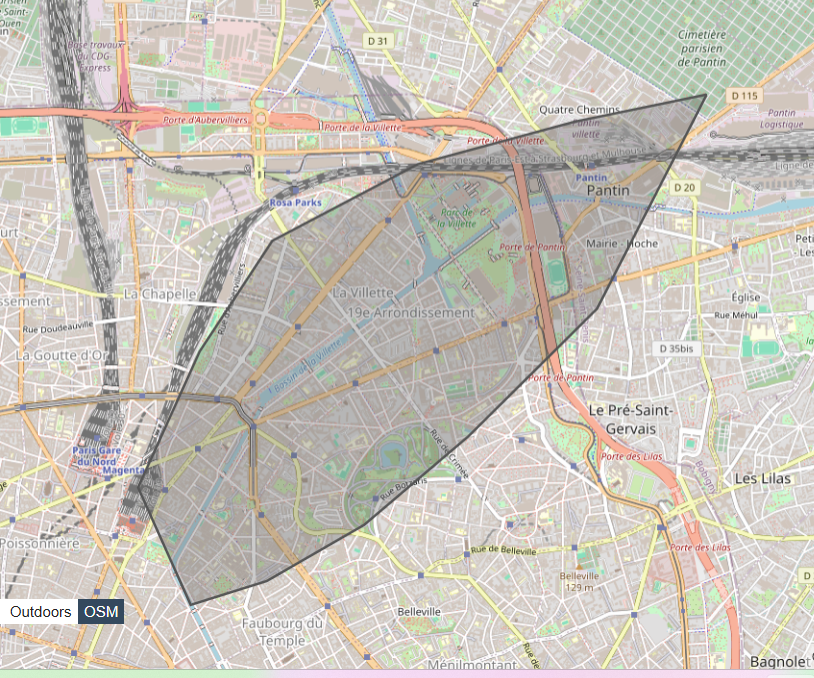
Finding the shape of the “19th arrondissement of Paris” (“Q204622”) requires detailed geo co-ordinates. The map that we have here has drawn an odd leaf shape.
“coordinates”: [
[
[
[2.3647, 48.8721],
[2.3802, 48.8768],
[2.4010, 48.8895],
[2.4108, 48.9021],
[2.3850, 48.8980],
[2.3720, 48.8935],
[2.3600, 48.8790],
[2.3647, 48.8721]
]
]
]
If there were more details in the GeoJSON and if these were stored on commons and referenced by Wikidata, you might also be able to use SPARQL to find the shape.
SELECT ?geo WHERE {
wd:Q204622 wdt:P3896 ?geo .
}
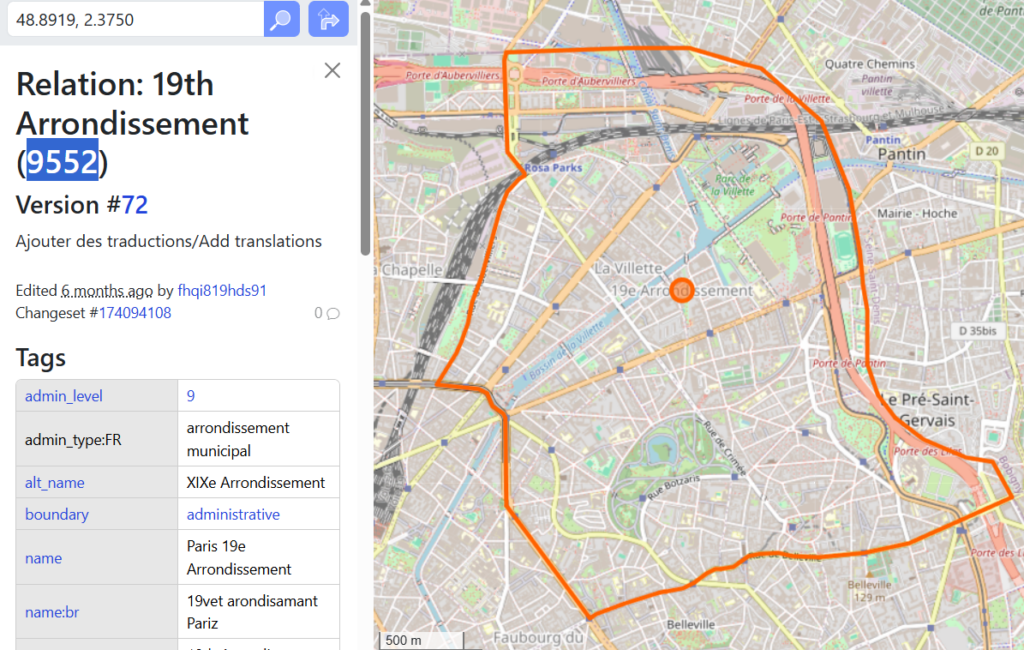
My manual attempt at creating a boundary shape is disappointing. Thus far, I have found the best way to obtain the desired boundary shape is with https://overpass-turbo.eu/ and a query that relates to a way or relation on OpenStreetMap
[out:json][timeout:25];
relation(9552);
out geom;
Using this query allows me to create an exportable GeoJASON file of the 19th Arrondissement (saved on Github) that I also adjusted and shared as Data:19_arrondissement_de_Paris.map on Wikimedia Commons.

Back to South Africa
Do we know all the locations of arts festivals in our country? If we try a simple SPARQL query (see example above) and place of the results in a table
| item | itemLabel | itemGeo | itemPic |
|---|---|---|---|
| http://www.wikidata.org/entity/Q3642773 | Aardklop | Point(26.9022247 -26.67771) | |
| http://www.wikidata.org/entity/Q6979502 | National Youth Jazz Festival | Point(26.526666666 -33.31) | |
| http://www.wikidata.org/entity/Q131057081 | Rocking The Daisies | Point(18.522784665 -33.48255583) | |
| http://www.wikidata.org/entity/Q1266836 | Durban International Film Festival | Point(31.025 -29.8583) | |
| http://www.wikidata.org/entity/Q137455846 | Clarens arts festival | Point(28.416667 -28.516667) | |
| http://www.wikidata.org/entity/Q10990225 | National Arts Festival | Point(26.5193 -33.3195) | |
| http://www.wikidata.org/entity/Q7098568 | Oppikoppi | Point(27.13611111 -24.88388889) | |
| http://www.wikidata.org/entity/Q6650288 | Little Hearts Festival | Point(18.420129 -33.904859) | http://commons.wikimedia.org/wiki/Special:FilePath/Littleheartsfestival2.JPG |
I can’t really make a geo shape to accompany this table. There are arts festivals here in Johannesburg. We can make a GeoJSON file of the Johannesburg Botanical Gardens (aka Emmarentia Dam). There are many events in this park. Can we use Turbo Ovepass to draw the shape?
[out:json][timeout:25];
way(23019683);
out geom;
Nope. Did not work. Can we draw the shape from open street map? Yes. Go to Export and download a ZIP file. Unzip and open the files with https://geojson.io/. You will find that the information is rather messy. You could clean it up with Open Refine Or just find the geo-coordinates that refer to Emmaentia Park. These are a few other https://tyrasd.github.io/osmtogeojson/ tools https://racum.blog/articles/osm-to-geojson/ that can assist with GeoJSON conversions. You now have a South African shape drawn with geo co-0rdinates.
Final Thoughts

Geospatial data infrastructures allows me to abstract alternate mapping systems (from SA). I think that we can (and need to) question both the human-made and the computer generated structures that promise to address our needs, wants and desires. If we explore our built environments (with the other underbuilt parts in between) and combine our own maps with our mediated networks. then will begin to see to see a socio-technical imaginary that’s been developed to fulfil a certain group’s needs, wants, and desires.
Our tangible environment has visible physical features and less visible infrastructures. For example, a library has visible components. Books, shelves, seating areas, issuing desks, study areas, and computers. Less visible is all the activities in the book chain, who finances the books on the library shelves, who sells software licenses to the city. On campus, the visible features include lamposts, roads, pavements, benches, transport, pedestrian bridges, lecture theatres, labs, studio’s etc. The faculties committee’s governance choices, procurement processes, computer budgets and MS license costs etc are less visible, and in some cases they are hidden. In this geo spatial world, what we call our mediated environments, the visible infrastructures are privately owned devices (laptops, phones, chargers). We are less likely to see the other infrastructures – wifi routers, servers, switches, undersea, DNS records, cables etc, that join to other privately owned infrastructures and intersect with other public and privately owned components. All these visible and less visible features contribute to the socio technical imaginary that we believe holds things together. While some of these structures are in our heads (called schema) these data infrastructures can be made visible. Increasingly, it’s easier to ask private companies to create and manage the visualisation of our socio-technical imaginaries, either in public and mediated spaces. (I’m available).
So what’s my point? Yes, turn to Google Maps for directions. Admittedly, this is easy to use. But as I mentioned in my presentation about epistemic opacity, component makers comply with their political masters to build these socio-technical imaginaries. And then they make the maps to show you around. So whether you are in a physical public or mediated private space. The architecture, the landscapes and designs, the background planning, budgets and management are a reflection of the “beliefs that affect or govern the behaviour patterns of society”. Can we see and recognise what’s going on in the under mapped world. Here’s a small glimpse.
Please take a look at my Arts Festival Dashboard. You can see the source code on codepen (this will change as I fiddle with the code). The dashboard will update as you add more arts festivals.
References
https://librarycarpentry.github.io/lc-wikidata/05-intro_to_querying.html
Neumann, A. (2008). Web Mapping and Web Cartography. In: Shekhar, S., Xiong, H. (eds) Encyclopedia of GIS. Springer, Boston, MA.
I have been blogging about spatial matters and have split my thoughts into three parts.
- Spatial (earth ) lens
- Spatial (human) lens
- Spatial (computer) lens