Have you been asked to write a “speaker bio” or “author profile”? My reaction is ….
<sigh>groan</sigh>.
Writing about oneself objectively and neutrally (especially in the third person) can be an uncomfortable task. I know about a “Goldilocks profile” (not too hot, not too cold, but just right). But… if I’m frank, I’ve never found that perfect bio profile.
Today, I’m trying something different. If a picture is worth 1000 words, maybe I should be thinking about visuals before words? Photograph albums are a preservation mechanism to represent our own background (usually favourably). Or take a “walking through ruins” (Harman) approach and collect pics of derelict factories, hijacked cities, abandoned towns or littered rivers. This introduces a critical awareness of how smoothed and regulated many spaces seem to be on our screens.
Then openly share your photos (with some sort of consistent theme), on Wikimedia Commons. If someone Googles you, they’ll find a bank of themed pics about you or your choice of metaphor on the knowledge panel. Or if your concern is not personal or critical, but simply educational. You could have a sequence of pictures on commons that appear in a slideshow.
A FMD theme
I mentioned this on Instagram. South Africa lost its FMD (foot and mouth disease) free status in 2019. This nasty cattle disease is spreading (we have had first hand experience of it). Folks in cities, who become country tourists for a week or two, don’t really know how to co-operate or are aware of this highly contagious disease. This is when I think that Wikimedia Commons is a great spot to share educational pictures and instructions for others to understand. Upload educational pics to Wikimedia Commons. Arrange them in some order. Share instructions in vernacular language on Wikipedia. And make sure your business has the know how to address the issue.
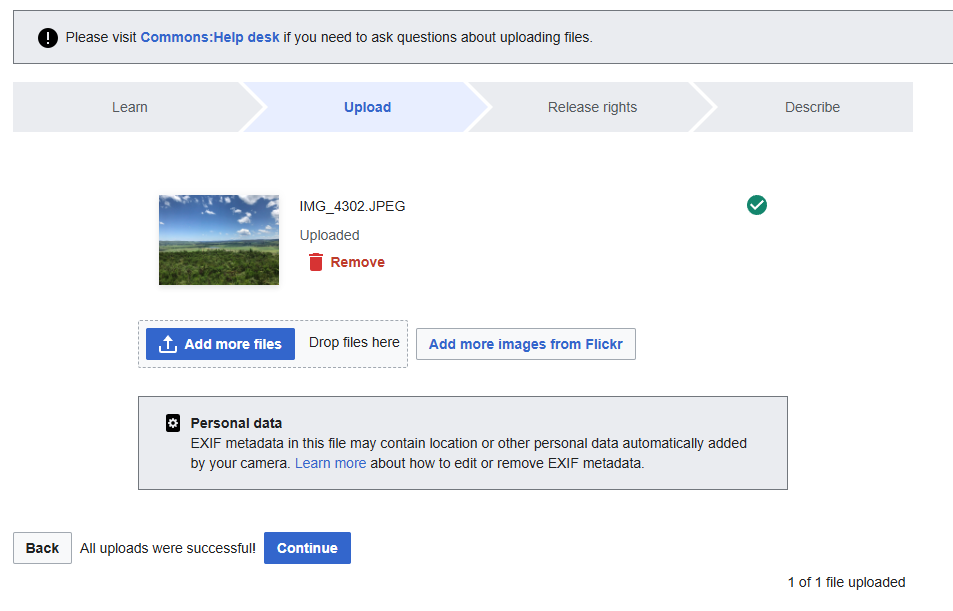
Ten step workflow for uploading images
Screenshot of the Wikimedia Commons upload Wizard
Here are ten steps to create a look and feel with Wikimedia Commons (adapted from Mike Dickison, CC BY 4.0 via Wikimedia Commons)
Select a batch of photos. High quality images are best, Wikimedia does adjust. You might crop them consistently. Think about how others will see them?
Respect copyright. You will be asked if there’s any copyrighted works by someone else in the photo.
Release rights. Think about the open licence? I prefer “CC BY” ensures you get credited whenever the photo’s reused. If you comfortable with code, you could try these templates with option 4 (of course you have to modify).
{{attribution|User:Derek J Moore|Weblearning}}
{{self|cc-by-4.0}}
Choose a filename. I keep it short (and try to ensure that I have got the spelling right)
Add a caption. The writing below an image is the caption, it places the image in a context. You have 255-characters to write the description. You might want to add a vernacular caption too?
Published date. Select the date when the image was first published
Describe Further. Add additional information. This is optional, but helpful for others
Insert a Wikidata item. There should be a main subject visible in the photo. Locate the Wikidata number and add structured data
Add a specific category. When working with a batch of photos you might want to add a category or use an existing one.
Location. You could add the geo-coordinates (or they might appear automatically)
MORE Additional information This is a hidden field. You might be uploading a map from open street maps. They you’d use the template {{OpenStreetMap}}
Post and Confirm. You are ready to finalise your post. All that has been submitted can be checked and corrected
Okay. Now look at you images as they appear on other knowledge panels
Scholia – view the scholarly profile of an academic or researcher.
Ohlange High School CC BY SA https://en.wikipedia.org/wiki/Ohlange_High_School
26-29 /04/ 1994 marked a key date in our country’s temporal knowledge graph (TKG). Nelson Mandela {{Q|8023}} chose to cast his vote at Ohlange High School {{Q|7081074}} located in Natal {{Q|917867}} This rural educational institution was founded in 1901 by John Langalibele Dube {{Q|1700787}} with his wife, Nokutela Dube {{Q|17308980}} when this part of the country was still a colony, known as {{Q|1301901}}
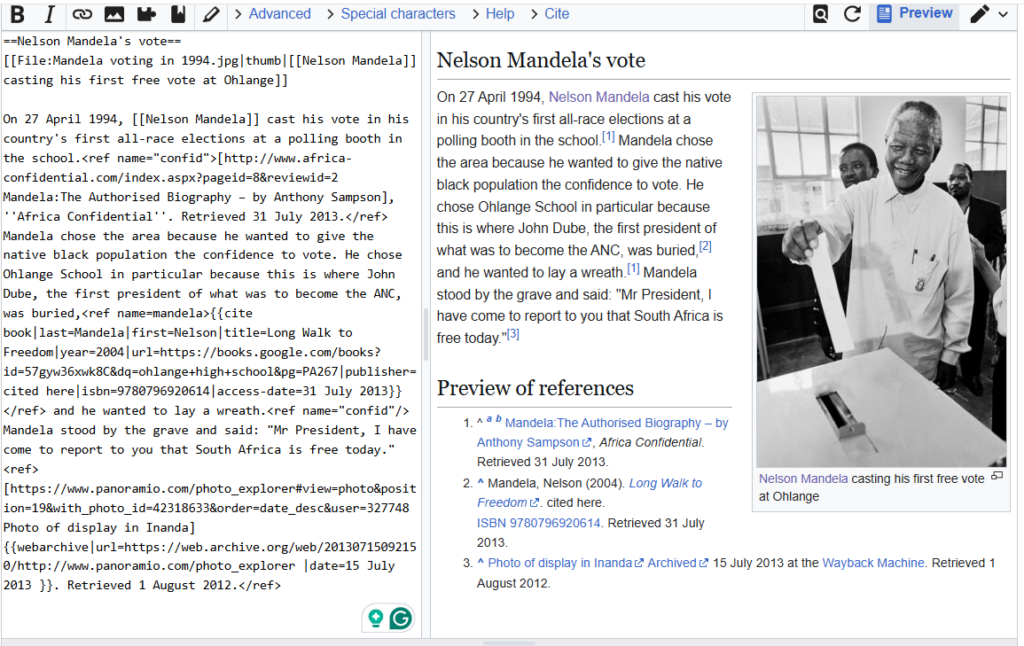
The Wikipedia markup in one paragraph reads (this might change)
[[File:Mandela voting in 1994.jpg|thumb|[[Nelson Mandela]] casting his first free vote at Ohlange]] On 27 April 1994, [[Nelson Mandela]] cast his vote in his country's first all-race elections at a polling booth in the school.
<ref name="confid">[http://www.africa-confidential.com/index.aspx?pageid=8&reviewid=2 Mandela:The Authorised Biography – by Anthony Sampson], ''Africa Confidential''. Retrieved 31 July 2013.</ref>
Mandela chose the area because he wanted to give the native black population the confidence to vote. He chose Ohlange School in particular because this is where John Dube, the first president of what was to become the ANC, was buried,
<ref name="mandela">{{cite book|last=Mandela|first=Nelson|title=Long Walk to Freedom|year=2004|url=https://books.google.com/books?id=57gyw36xwk8C&dq=ohlange+high+school&pg=PA267|publisher=cited here|isbn=9780796920614|access-date=31 July 2013}}</ref>
and he wanted to lay a wreath. Mandela stood by the grave and said: "Mr President, I have come to report to you that South Africa is free today."
<ref>[https://www.panoramio.com/photo_explorer#view=photo&position=19&with_photo_id=42318633&order=date_desc&user=327748 Photo of display in Inanda] {{webarchive|url=https://web.archive.org/web/20130715092150/http://www.panoramio.com/photo_explorer |date=15 July 2013 }}. Retrieved 1 August 2012.
</ref>
You will see that I have highlighted a few parts of the code.
The image and the ticket
File:Mandela voting in 1994.jpg is a photo taken by Paul Weinburg {{Q|83287233}}. The caption from his books reads “Nelson Mandela votes for the first time in his life, Ohlange High School, Inanda, 1994.” Paul attended the same school as me (he was 10 years ahead) and Pessa (his mom ) helped Chris Sexon to produce school plays. I performed in lots of them.
Isla uploaded a few of Paul’s photos to Wikimedia Commons. She must have got permission since the VRT team have been rather strict (I often get zapped). The Volunteer Response Team manage permissions with {{PermissionTicket}} system. Paul’s permissions number is 2013062010004691 and a login is required to see what other pictures have permissions. The following SPARQL query will allow you to find other photographs that Paul took. https://w.wiki/FyXE .
How to write references on Wikipedia
There are three cited references in the paragraph.
<ref name=”confid”>[http://www.africa-confidential.com/index.aspx?pageid=8&reviewid=2 Mandela:The Authorised Biography – by Anthony Sampson], ”Africa Confidential”. Retrieved 31 July 2013.. </ref>
{{cite book|last=Mandela|first=Nelson|title=Long Walk to Freedom|year=2004|url=https://books.google.com/books?id=57gyw36xwk8C&dq=ohlange+high+school&pg=PA267|publisher=cited here|isbn=9780796920614|access-date=31 July 2013}}
[https://www.panoramio.com/photo_explorer#view=photo&position=19&with_photo_id=42318633&order=date_desc&user=327748 Photo of display in Inanda] {{webarchive|url=https://web.archive.org/web/20130715092150/http://www.panoramio.com/photo_explorer |date=15 July 2013 }}
Wikipedian editors seem to prefer articles that use {Template:Citation}, as used in the second example. References can also be made using <ref> </ref> or you could use use one of these these tool. It’s also a good idea to archive references, as this helps address link rot {{Q|1193907}}. Even so, reference three cannot be seen. This information in this paragraph, on commons and Wikidata is both human and machine-readable.
Unpacking a TKG
Let’s explore this paragraph further. Anthony Sampson {{Q|573976}} became a friend of Mandela {{Q|8023}} in the 1950s. He was asked to edit Drum Magazine {{Q|1135670}} by James R. A. Bailey (aka Jim Bailey) {{Q|13522443}}. They both were British citizens {{Q|131192319}} had attended the University of Oxford {{Q|34433}} and {{Q|573976} rescued the paper, acted as editor from 1951 to 1955, and then went on to work for The Observer {{Q|336197}}. In 1964, Anthony covered the Treason Trial {{Q|1119564}}and reputedly advised Madiba on his moving defence speech from the dock:
“It is an ideal which I hope to live for. But if needs be, it is an ideal for which I am prepared to die”.
Knowledge graphs use “tripples” to establish facts. You will see that there are three components of this small portion of the TKG
Entitees (nodes): Drum Magazine, Oxford University, Treason Trial and the tangible, real-world objects, places and people
Relationships (edges): Jim, Anthony and Nelson were connected entities
Timestamps: A time range where the relationship or event remains valid
Put another way
Node:
Anthony Sampson
Drum Magazine
Jim Baily
Nelson Mandela
Edge:
Citizen of; Educated at; worked for, friend of; Publisher of
Owned by: Target audience:
Citizen of; Educated at;
friend of
Timestamps:
1951, 1964
1951
1951
1951, 1964
Look, this is very rough and I’m not quite (yet) an ontology engineer but my ratonale seems to be making some sense. When go to Chat GPT {{Q|115564437}} and ask it this question…its obliges!
Prompt I made to chat GPT
Now why don’t you try to prompt your TKG? Here are some suggestions. – Create a timeline for Anthony Sampson
Who graduated from Ohlange High School and when?
Final thoughts
The quote attributed to Mandela in the above excerpt
“Mr President, I have come to report to you that South Africa is free today.”
might be about respect and going back roots. But Dube’s legacy as the founder of the SANNC is complicated. He was ousted in 1917, he has been claimed by different factions of the liberation party, and the relationship between the ANC and Inkatha was fraught at that time. This seems like hagiography to me. I would insert this preceding phrase, “Mandela was reputed to have said….”
Zhu, J., Fu, Y., Zhou, J. et al. A Temporal Knowledge Graph Generation Dataset Supervised Distantly by Large Language Models. Sci Data 12, 734 (2025). https://doi.org/10.1038/s41597-025-05062-0
Organizing and classifying information appeals to me. I appreciate a good set of WordPress tags. But I’ve never managed to get a system that works.
Wikipedia’s “Categories” are used to group or cluster pages on similar subjects together. Categories help the reader to find more information about a topic area. Categories organize and make connections between information.
Wikimedia’s user-box is one way in which contributors group or cluster themselves. It’s a familiar and common practice. Some geeks choose to decorate the apparatus that they work with or on with stickers. We are encouraged to personalise our desktop screens with photos, our social media with avatars. Or out on the road, we put slogans on our car back window or bumpers. These “decorations” are how people attempt to display their own identities or affinities. It’s another way for others to see who they are, by the marks or footprints they have placed on their tech.
Whether it be art work, emoji’s, photographs, or other sort of images, we can use images to quickly show ourselves to others without words. A user-boxes (see below) is another way that a Wikipedian tells a simple data story for other Wikipedians, to gather around, cluster and collaborate.
Affinity groups
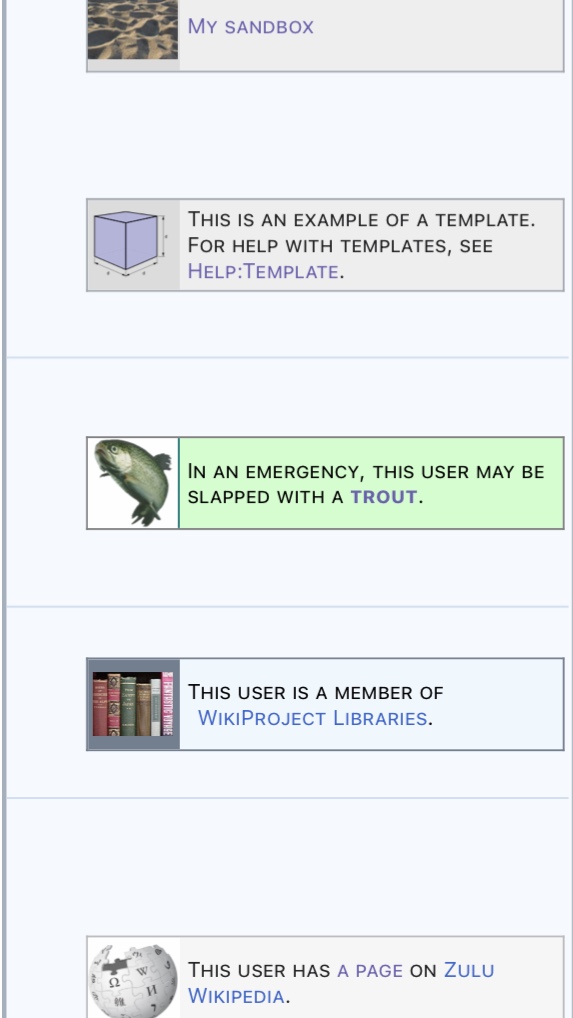
A user-box can lead to an affinity group. I’ve included a few of them eon my User box cheatsheet (User:Derek J Moore/Templates). The list includes {{My sandbox}}, which directs the logged-in Wikipedian to their own Sandbox or {{Example}} which shows you how to create a template. I’m hoping that you will start becoming comfortable with templates. My favourite affinity group I’ve chosen to associate with involves getting whacked with a wet trout!
Adding images to an userbox (to start your affinity group).
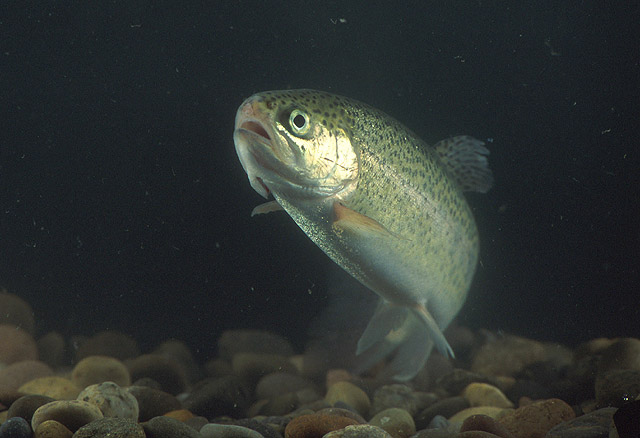
If you want to create an affinity group, you can make your own userbox with images found on Wikimedia Commons (that’s where the trout picture came from). You can also upload your own images and license them openly. If you are going to refer to a book cover or logo in a userbox, then a non free rational is necessary for the image to remain there and not be speedily deleted.
The elements of this affinity group.
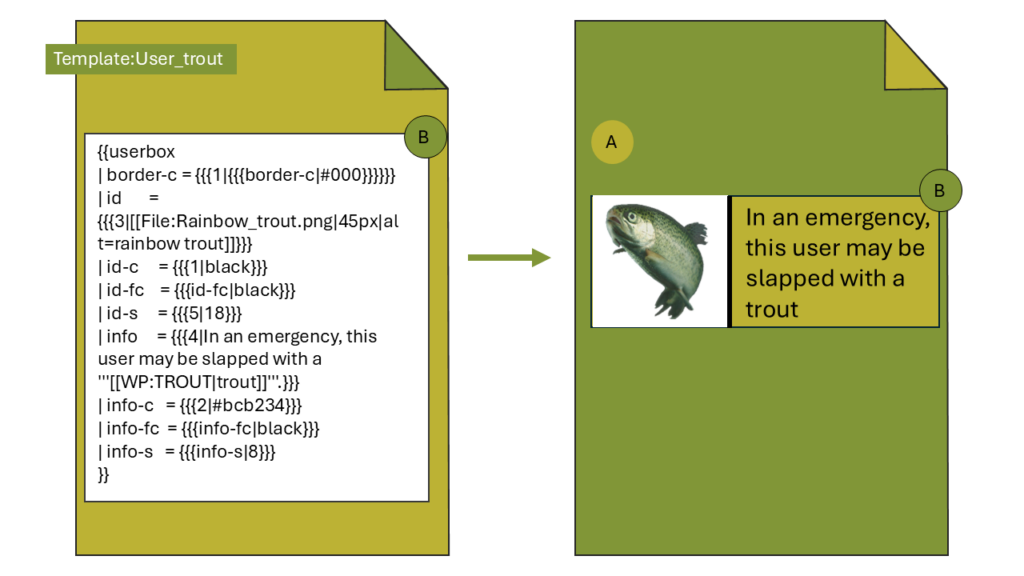
A wikipedian indicates their willingness to receive constructive criticism on their talk page by adding {{User_trout}} to their sandbox. These four curly braces {{}} create a template. When this {{User_trout}} template is placed on a sandbox, a small cut-out icon of this trout appears on the top right of the page (1).
By going to that persons talk page and adding {{trout}}, a “trout me” message will appear in the text (2).
{{User_trout}} or https://en.wikipedia.org/wiki/Template:User_trout appears in the URL bar. It begins with the en language code and then the word Template: (https://en.wikipedia.org/wiki/Template🙂
Template:User trout could also be seen as a page name. This page is intended for inclusion on another target page. The technical term for this action is transclusion. A userbox from a source page (B) is transcluded into the target page (A).
Transclusions happen behind the scenes in Wikipedia
Transclusions are useful because they mean that when you update the source page (B), all the other target pages (A) are also updated. Transclusions are also fun. I use them often in my sandbox or when sending messages or announcements.
If you look at the code above, you will see several named parameters. For example, “id” refers to the trout image image. “Info” refers to the message that goes along with the trout. When using small templates, there is sometimes the possibility of unnamed parameters. These parameters are numbered rather than named, using {{{1}}}, {{{2}}}, {{{3}}}.
You can also do transclusions with Wikidata and call and pass parameters. WARNING:This can gets even more complicated.
Transclusions also happen behind the scenes with Wikidata.
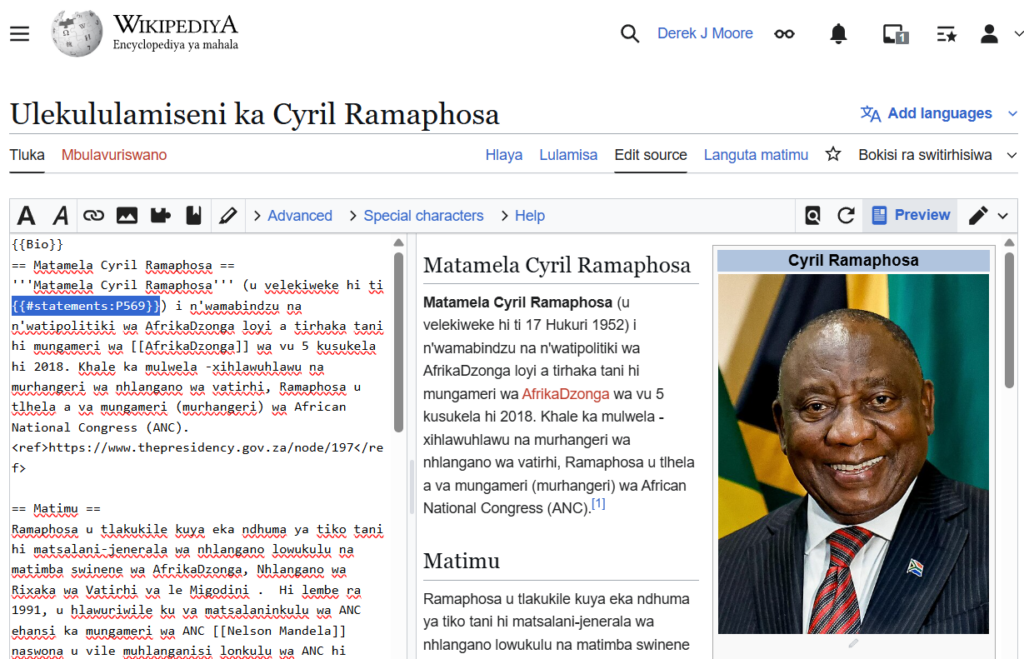
To transclude information acceoss from Wikidata into a Wikipedia page, you need to use another function. I placed Cyril Ramaphosa’s date of birth (listed on Wikidata) into his Xitsonga Wikipedia article (highlighted in blue). Notice it is NOT in English.
Notice the highlighted statement. The date of birth (P569) was called.
I did the following.
Logged in and hit Lulamisa. I then switched from visual editing to source editing and viewed the code (see the “Split View” above).
Called the Wikidata property number of “date of birth”, which is P569. Place the curly brackets and the page to be trancluded {{#statements:P569}} on the President’s article (see left side, highlighted in blue).
If I did this on en Wikipedia it returns “17 November 1952”. If I do the same in Xisonga, then I will get “17 Hukuri 1952”. (I hope that is correct).
Perhaps you could try this in another language?
Code used in the template called Bio
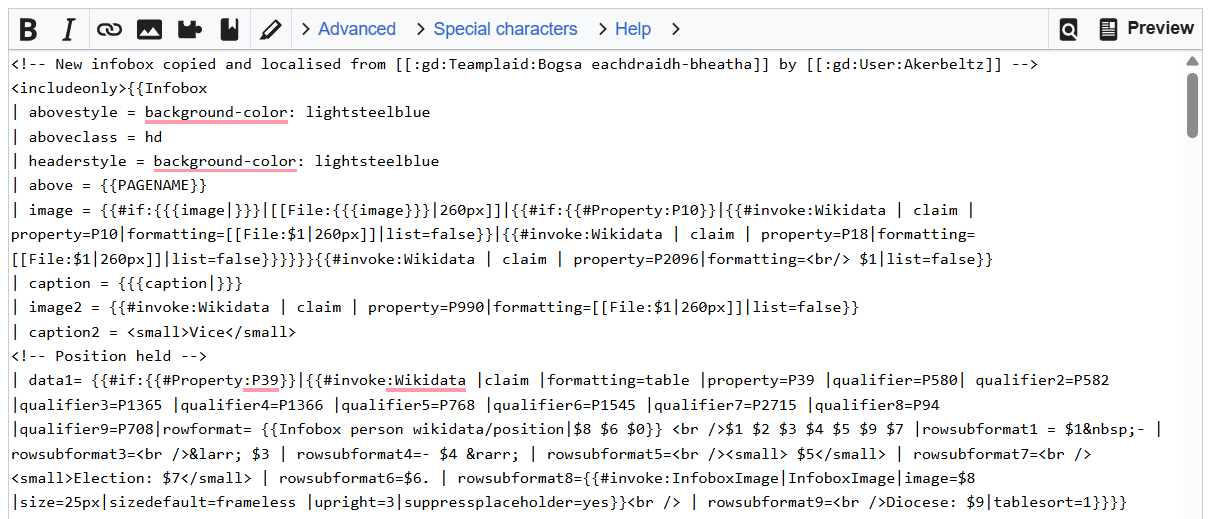
{{Bio}} is another transclusion. Like {{User_trout}} this template has code that creates a layout. The Bio template also pulls in paraters from Wikidata. I discovered {{Bio}} on Teamplaid:Bogsa eachdraidh-bheatha. It’s still experimental.
Look for the opening curly braces. That’s where the template begins
Infoboxes are like userboxes, just a bit more wordy. They usually contain key information about the subject. I’ve copied the first 20 lines of the above mentioned infobox
The template needs to be standardised as a name by WMZA. I’ve called it {{Bio}}, {{Umuntfu}}, and {{Bo}} on vernacular Wikipedia.
Calling and passing parameters in a sandbox.
This bio function (shown above) also contains another function. It’s called {{Databox}}. Databox uses a single Lua module to call Wikidata properties and request different types of information associated with those properties. I suggest that you experiment in your sandbox.
The examples below are in three languages.
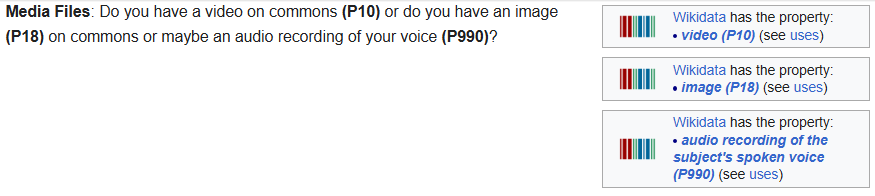
Media Files: Do you have a video on commons {{Wikidata property | P10 }} or do you have an image {{Wikidata property | P18 }} on commons or maybe an audio recording of your voice {{Wikidata property | P990}} ?
Posted into my English Sandbox
Positions Held: What position do you hold {{Wikidata property | P39 }} , when did you start in that role {{Wikidata property | P580 }} and when did it end {{Wikidata property | P582 }} ?
Posted into my Tsonga Sandbox. Google Translated. There may be errors
Personal Details: What was your birth name, {{Wikidata property | P1477 }}, where was you place of birth {{Wikidata property | P19 }} , what was you date of birth {{Wikidata property | P569 }}?
Posted to my Afrikaans Sandbox. No translation on the left. Properties are translated automatically on the right.
As you can see, English and Afrikaans are well served. Xitonga (and the other SA official languages do not have this Wikidata template running (yet).
You can look at the Template:Infobox Biography2 {{Q|20829728}} number and can see a template page which allows you to create info boxes in bibliographic articles. Then squiz through different examples. You might need to look at the code version.
Code’s Purpose both transclusion and translation.
The code automatically fills in information about the subject using Wikidata properties. I am describing this code in English, but I’m hoping non-dominant language Wikipedians can use this for their context. I used it for Bobby Shabangu’s Wikipedia pages on four vernacular pages (the Afrikaans version got deleted).
More about Wikidata powered Info boxes
Want to know more. Sadik Shandu has a handy video. Want to make an {{infobox for bibliographic entries}} on your language version (Sorry, only catering for South African’s here). Then your task is to check out the examples below.
I still need to do the other seven languages. All of these require a help page in a matching vernacular language. Good Luck as you wrap your head around this.
Kate (Q1252986310)and Ravi (Q135189340) are good friends with Dr Susan (0000-0001-9554-4948), who is our next-door neighbour here in Richmond (Q61359147). Our lives occasionally intersect at birthday parties or tea. Their two gals also went to Parktown High School for Girls (Q7138735), like my two.
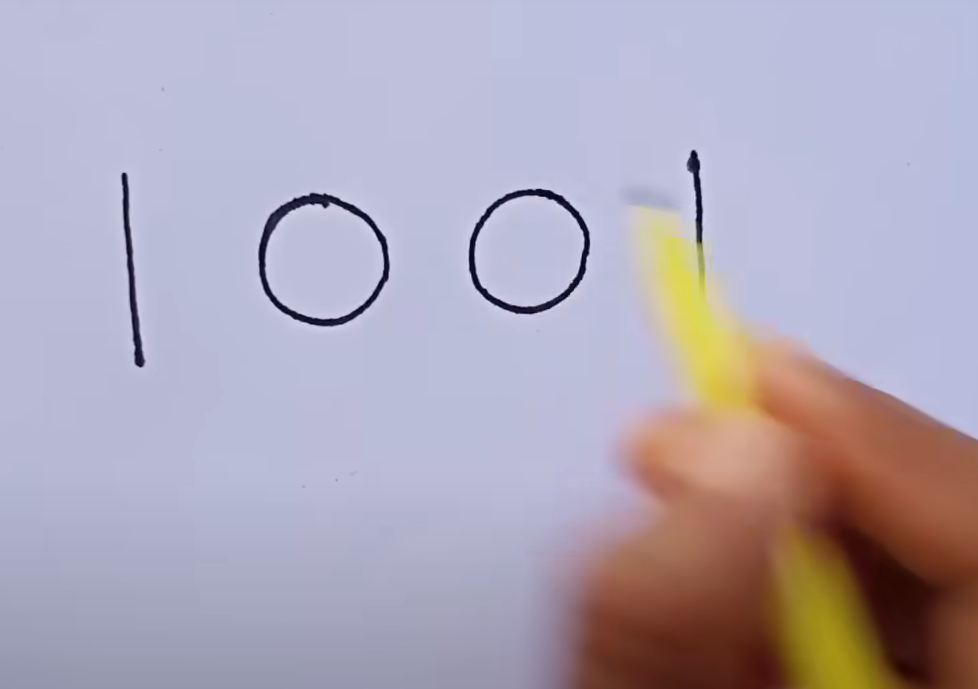
None of these identifiers are as memorable as that of Q1001 (Mahatma Gandhi). However, if you visit any Wikidata identifier, you can verify that they say who they are by either viewing their references. Or by using other identifiers, like Susan’s Orcid. You can see that we are a clutch of academics, journalists and activists.
These identifiers will also allow you to display a family tree (if the data is there). Want to show the links between father (P22), mother (P25), parent (P8810) and child (P40). Visit GeneaWiki https://magnus-toolserver.toolforge.org/ts2/geneawiki/ and enter Gandhi’s tripple identifier (Q1001). You will see the family tree in another format. Want to understand what’s going on behind the scenes? That’s where we start asking questions.
The linked data stored on the centralised data repository (Wikidata) is being used to construct a family chart, or tree. Another term for this arrangement of real-world entities is a “semantic network“. All Wikimedia projects have the option to draw their information from this central place and construct a structure that encodes and represents knowledge. The infobox you see on a Wikipedia article is a neat way to present the basic facts of an article. That infobox might be filled with information presented on the page. Or the data could be pulled from Wikidata to create a knowledge graph (Q33002955). And this can be done in multiple languages.
Now this is Mike’s (Q26207216) lovely infobox work, and his handy tutorial. It’s how you can create a knowledge graph (I think). Here in South Africa (Q258), I have seen this Wikidata infobox in action on Afrikaans Wikipedia called {{databoks}}, on the siSwati Wikipedia called{{umuntfu}} and the Xitsonga Wikipedia called {{Bio}} The vernacular versions are undocumented. Pity. To quote an administrator: “Dit is ‘n gemors.” Oesjaar is keeping growing the af community. Credit to him.
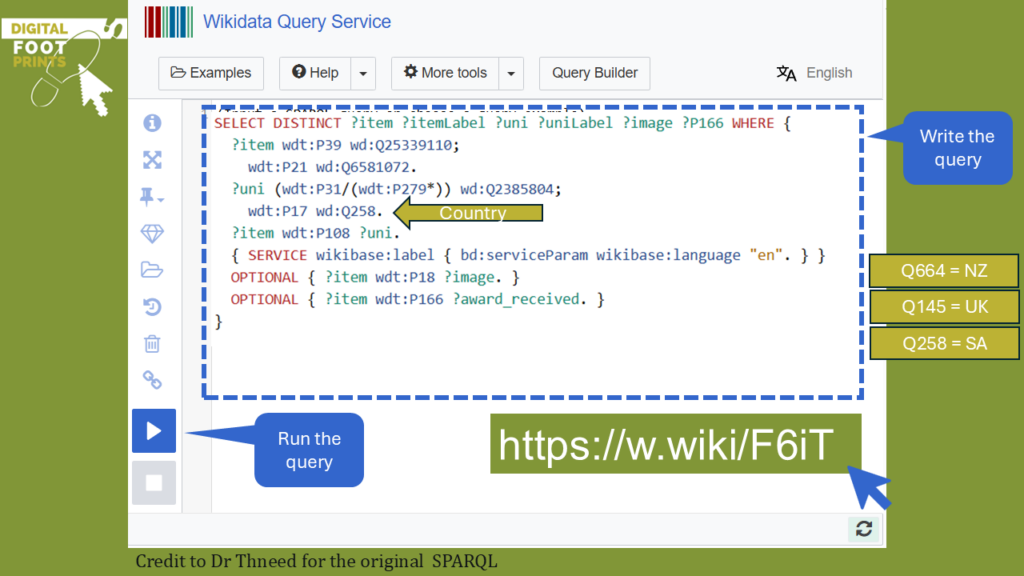
As I become familiar with Wikidata, I think it’s necessary to learn how to query Wikidata directly for results. Instead of going through third-party code, use a language known as SPARQL (Q54871). I’m not going to try to create an infobox. I’m going to write a query (and credit to Emre Yüksel for his fine tutorial) that will draw on Wikidata to begin to show Ravi and Kate’s family tree (they asked me to assist in this matter).
My task is to find the parents of Ravi. I’ll express this first in non-SPARQL terms.
Let’s combine these identifier properties and prefixes into our SPARQL query.
#find the parents of (Q135189340)
SELECT ?parent
WHERE
{
?parent wdt:P40 wd:Q135189340
} https://w.wiki/F7oJ
Now, let me not deceive myself. This query seems pretty basic, and yet it has taken me a whole day to get it working smoothly. There are also many things I can’t figure out. For example, I’d actually like to express the names in the result. But I can’t quite get that right either.
SELECT ?father ?fatherLabel
WHERE
{
 wd:Q135189340 wdt:P22 ?father
 SERVICE wikibase:label { bd:serviceParam wikibase:language "[AUTO_LANGUAGE]". }
}
I’ve use the word “Wikidata” repeatedly in blog posts over the last few months. SPARQL is the way in which you can query Wikidata. I’ve found the easiest way to learn how to “Sparkle” is by experimenting.
I have deleted the rest of this blog post. Weird technical glitches.
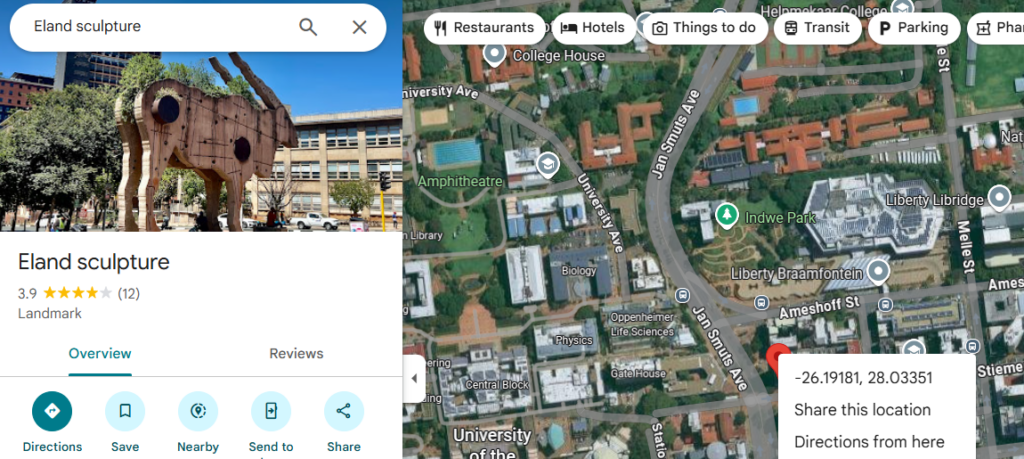
Clive van den Berg’s (Q106259021) “eland” welcomed me to Braamfontein when I came up from Pietermaritzburg for a job interview in 2009 with SAIDE (took me a while before I created their Wikipedia page). In the wild, this buck is the second biggest antelope in the world. The Kudu (I’m told is the third largest). This sculpture stands very tall alongside the entrance to the Tin Temple, Pretoria Road. (oops, these name changes always get me). In concrete, this representation of a common eland weighs 50 tons and is 7.5 metres high. Yet another security guard (or armoured car), separating the inner city from the northern suburbs? As of today (9 August 2025), “Tragelaphus oryx” does not have a Wikipedia entry. The Kudu clan does have a couple of entries in English and Afrikaans, but their isiZulu and Sesotho Wikipedia Pages are not yet touched by Phase 1. (I’m sure that SWiP can help, but maybe the Kudu bots could do it better. I digress.)
Public artworks – statues, memorials, murals, plaques, like Elkie, (Eland comes from the Dutch work elk) are notable enough to have their own Wikidata item. Our giant but common eland watch person should be no exception. He deserves some public recognition. He’s still standing up straight, unlike many of the city’s place lighting lamp posts and pace-setting traffic lights. Want to add a Wikidata item for this eland? Perhaps another place making piece of public art? Five steps and you too can insert him into the relational databases of the world’s culture vultures.
Step 1 – Find a WikiProject data model.
Wikidata can seem daunting and constructing tripple statements are bit confusing. We are all used to frameworks and not relational data. The public art data model with exemplars could act as a guide. Another place to look for inspiration is international public art examples?
Step 2 – Avoid duplication
Go to Wikipedia itself and search whether the item (the eland) has an entry. Do the same thing on Wikidata. If there is no Q label – you are ready to go.
Step 3 – Names and descriptions
Give the eleand its Wikidata name and add a short description (no capitals) and then click create. You now have an empty Wikidata item, but no statements or an image on Wikimedia Commons.
Step 4 – Statements will follow
Unsure about adding statements? Remember to follow the data model in the WikiProject. Search for the location on Google maps. Right click on the red pointer. That’s the geolocation at the top of the menu.
Remember to verify the statement you added with a “reference URL.” The Wikidata entry is far more useful when it can be verified. The eland has plenty of more informative websites to explain the significance of this work.
Step 5 – Add an image
All that is left is to take an image and upload it to Commons. Instructions below are taken directly from Uploading Files CC BY SA
Go to the Upload Wizard on Wikimedia Commons. On the first page of the wizard, read the illustration to understand whether Wikimedia Commons can accept your upload.
When you’re ready to upload, click Next near the end of the page. Click Select media files to share and find the image or images you want to upload from your computer.
Licensing your file Click Continue and select the options that apply to your upload, as prompted. When you are done, click Next.
Organizing and describing your upload Enter a title for the image. Use plain, descriptive language. Then enter a description of the image and the date it was created.
Add a category Help organize Wikimedia Commons by assigning categories to your file. When you are done, click Next.
Copy and paste the URL into the image label. Finished. Hit submit.
This is how you build an item, contribute to Wikidata and show the city’s culture.
P.S. I do not pretend to understand “Freedom of Panorama” (maybe Denise can help). It seems there may be problems with uploading certain pics to Commons. If you are uploading photo’s that you have been given permission to upload, then this release generator is super useful.
References
Minty, Z. (2011) Public Art Project in post-apartheid South Africa:Visual culture, creative spaces and postcolonial geographies.
I like being understood. Like most people, I prefer it when others get me. When I go back to Pietermaritzburg, am with my school and university friends, or when with family, it feels as if I am with people who get me. Know both me and my context.
I think that we make sense of the world by connecting data and arranging it into information entities. I feel knowledgeable when I can create a cohesive picture from the accessed data, information and entities. Jean (I think) does this in words. I usually represent this information entity visually with pictures, charts, a Johari Window, the dreaded pyramid or other familiar patterns. This can sometimes be a bit static and flat.
WORDLE
For people who do not do Wordle, this collection of multi coloured squares seems pretty meaningless. For those who understand the activity. They understand what this means.
⬜️🟨⬜️🟨🟨 🟩⬜️🟨⬜️🟨 🟩🟨⬜️🟨🟩 🟩🟩🟩🟩🟩
For those who do the Wordle regularly, the collection of daily guesses to arrive at the correct solution can be analysed. Grant Sanderson has done a lovely deep dive. With a subscription to NY Games, you too can buy data-driven insights to improve your Wordle strategy.
So familiarity with the game offers a context for understanding the system. The structure of the game enables programmers to create a clever machine that assists them. This ongoing collection of data and comparisons between all NY Times Wordle players allows for the formation of a knowledge graph. Which is explained far better than I can by Wey Gu
Most of the software systems I’ve used in education have focused on the storage and retrieval of data. The facilities for entering data are form fields or a grid. The result is database of rows and colomns. Data is extracted outof the rows and columns and represented in different ways to arrange it (table, bar chart, pyramid) so that it makes visual sense to others. But too often, we forget about the context around the data, or lack the insights about the people who are answering questions or collecting data.
A knowledge graph is another way of arranging data and information. Instead of holding data static in rows and columns, a knowledge graph organizes information in its natural form: a web of interconnected entities. The mapping of these entities — objects, events, or concepts — and their relationships creates an interconnected schema. I’m still new at this and I don’t quite understand edges and nodes. That (hopefully will come).
A flexible schema behind a knowedge graph makes it possible to add new data and information and relationships between the data points can suddenly emerge. Patterns that might get lost easily in a traditional database become visible with a knowledge graph.
Magnus has shared an amazing lot of open source tools that make use of Wikidata. I think it’s his code and the thoughts about the pluriverse (thanks Michael) or transmodernism (thanks Nicholas) that have prompted this post.
It’s been a month of changes, which have come in many shades. Cara got to visit Katy in Berlin for the July Holidays. Just after her return, Daisy died (24 July 2025). In a few weeks’ time, Simon will be heading over to Dorset to teach at Milton Abbey and the rest of the family (except Amy) will follow. Mom and Dad celebrated their 80th last year. I am turning 57 in August, Jean’s birthday and our 27th Anniversary is in September. Anna will be 21 in less than a year and Cara is into matric.
Perhaps it’s mortality or maybe it’s the work that I’m doing on the Naidoo’s Family History. Or perhaps it’s because of Paul (and his brother Moses). But I’ve recently really got into the relations within’ family knowledge and finding ways in which I can make knowledge visible as an object by with knowledge structures (Bernstein).
In other words, we are looking at “Family Trees”.
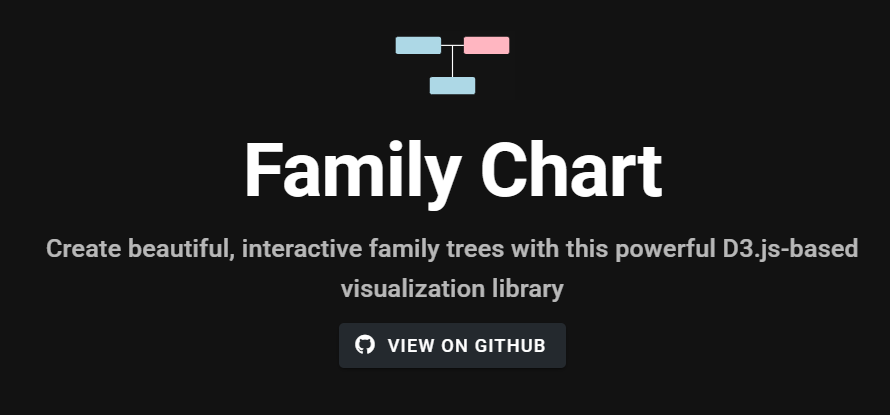
Today I thought I’d show how you can make a good old family tree (or a chart), that I stumbled upon at Reddit, made by Donat Sorić, and shared under a MIT license.
Families are complicated
Creating the chart/ family tree requires clear instructions. Family structures are sometimes complicated and drawing them with openly licensed resources (and saving them) can be a challenge. You will need one essential website (and two optional services) for your tree. And a pencil and piece of paper.
A GitHub account (very useful, but don’t stress if you don’t get it)
In this post, I aim to break the family chart creation process down into small steps and provide links to working examples. Before I begin, some thoughts about teaching with devices.
We learn better when two (or even three) people are at a screen. We are social. We understand with each other and when we speak to each other.
We often prefer application and choice over instruction and dialogue. I often give a small introductory task, to determine prior knowledge. For example, when beginning a workshop, I’ll ask workshop participants to take a shelfie and then share this image. Some might elect to use Wikimedia Commons. This activity reveals a few things about skills levels, and this then is a prompt for dialogue and instruction.
We don’t get it right the first time. I try to narrate my process in different ways (spoken, audio file, video example) and am quite comfortable with making mistakes in front of an audience, asking for help or modelling how to find answers. Not getting something right the first time is standard neither can we do it all by ourselves.
If those in a workshop can talk, show each other how to do something and identify their mistakes. Then they should also be able to self-diagnose their own or their peers’ work. I also use an external exemplar and haul it out when things really go wrong.
Pen and pencil. Name of your Mom and Dad. Sisters, brothers, grannies, gandparents. aunts and uncles. This is the flat way to draw a family tree. You will need a name, surname and their date of birth. Now you could also create a family tree on Wikipedia using the Ahnentafel System (see my first ancestor table) or the Wikipedia’s tree chart template (see my second incomplete family tree). Our social relations have generated a “knower structure” (Lucket 2009), and anyone from the immediate family could login to Wikipedia correct mistakes.
Step 2 – Transferring paper to a PC with Family Chart (mobile screens are too small. Move to step 5)
Now, take a look at Donat Sorić and his amazing work https://donatso.github.io/family-chart-doc/ I made a small start with my family. If you know the Moore Crew I think you can fill in the gaps.
On Family Chart’s launch screen, you’ve got a few possibilities. You can
Start with Examples
Create from Scratch (we will do this first)
Or try Wikidata Integration
Step 3 – Start from scratch
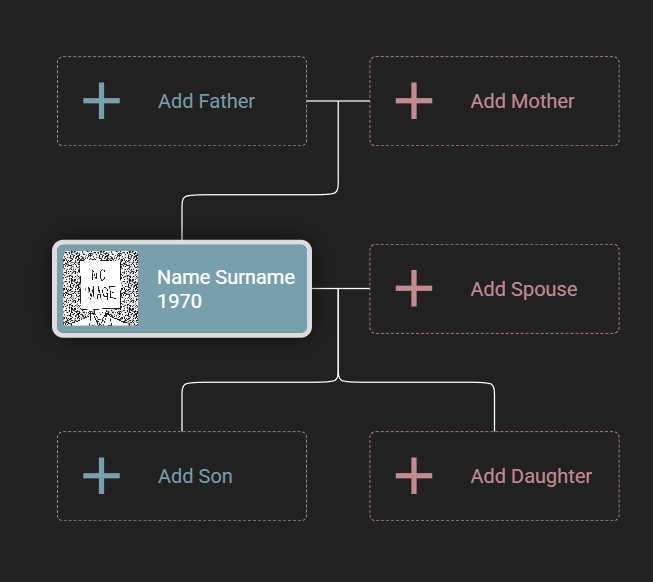
We are going to start from scratch and face a blank screen. Remember the piece of paper that you created in Step 1. Take out that paper and transfer the details onto the chart
Click on the person (I’ll do me, the dad)
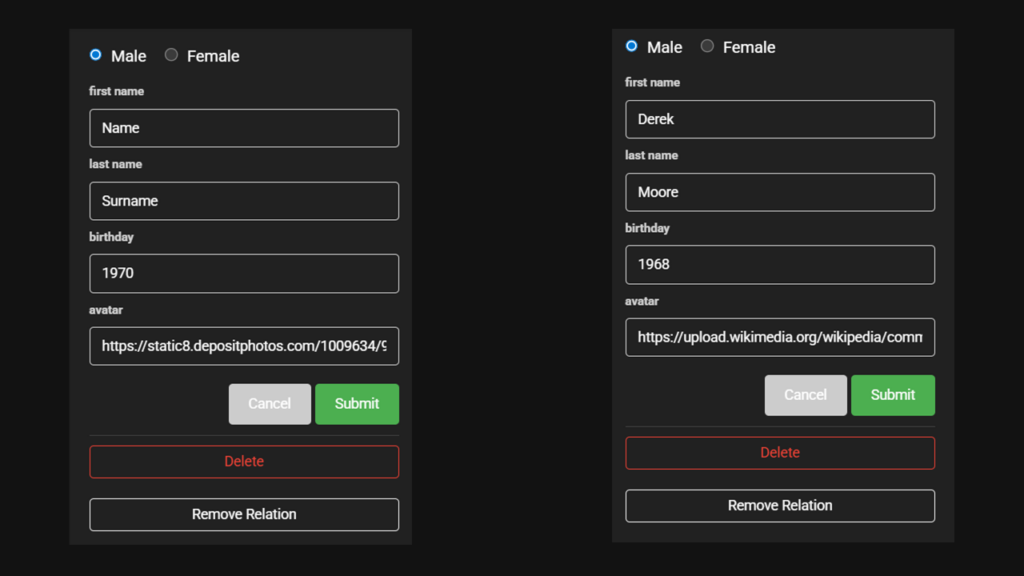
I then add my details.
First name: Derek
Last name: Moore
Birthday: 1968
Avatar: My photo is already on Wikimedia Commons
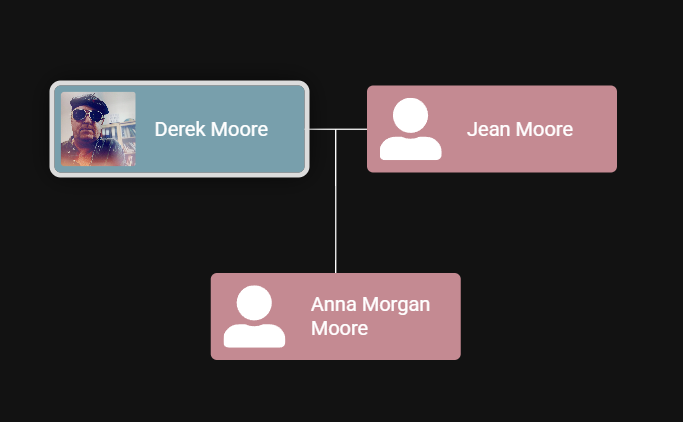
Then its Jean and Anna. You will see that I have listed three of us below. Only Cara is missing. Want to help?
Go to Wikidata and search for yourself. You might find a reference to a paper that you have published or you might already have a Wikidata number.
Exemplar 1 – Wikidata on a mobile phone
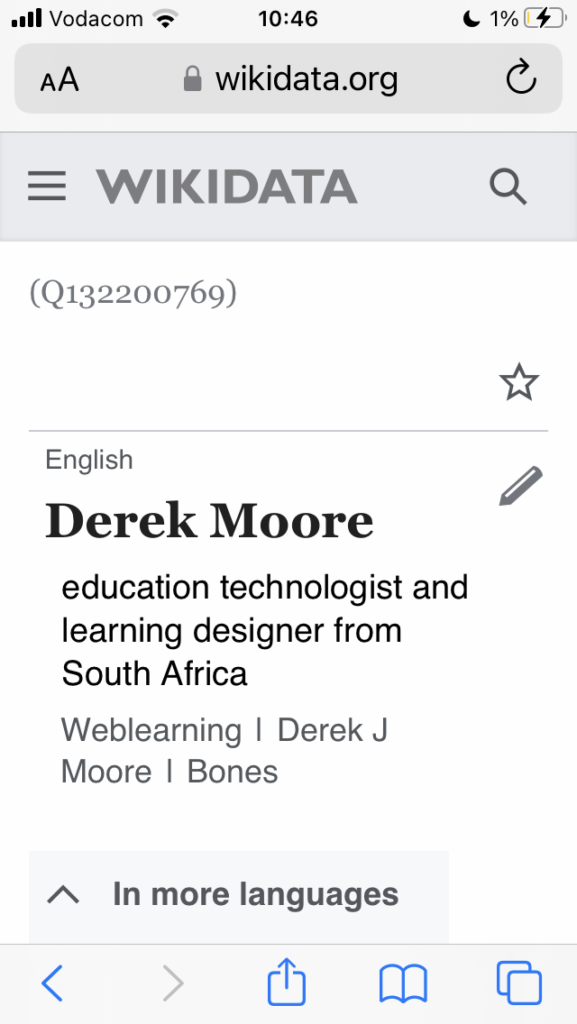
I have the item identifier Q132200769 (confession, I added it myself) and the label Derek Moore. The description provides some information about me. And the aliases are other names that I am known by. Further down the page, you’ll notice that I have listed a few other details
Our family are lovely, but (honestly) we are not historically notable (and Cara does not want a Wikidata number yet). But this is what our family tree looks like on Wikidata. Each of us has a label on WikiData
Exemplar 2 – Gandhi’s and Wikidata on a desktop
I’m going to swwitch focus and suggest that we use Gandhi’s item identifier (Q1001), and look at how the tree draws on the many images on Commons
If you click on any person on the family tree, then the tree grows. At the top, you can see the Identifier. You can either go to Wikidata with that number to see the meta information.
Step 6 – Verify, Verify, Verify
Drawing up a family tree (when you don’t know the family) can be difficult. It is very easy to make mistakes. When adding details to Wikidata, you should have a reference for all the statements that have been made, including family relationships But that’s another topic for another tutorial.
Step 7 – Save your work
At the bottom of the family chart, there are four ways to view the data in the family tree. If you have a GitHub account, you can fork the chart code and save your own family tree work in the examples folder (complicated). Alternatively, you could save the file onto a memory stick (simple) or onto your own website (easy if you have to have a website). Then go ahead and paste the file into the data section.
Well done. You should now have a family chart / tree.
P.S. I’m also hoping to attend a heritage conference soon, and I’d like to work with a fellow Wikipedian and lead a workshop about how to use Wikidata, GitHub and a piece of open software for constructing a family tree. Of course, all this information is openly licensed and attribution (or a cup of coffee) would be appreciated.
The next step is to learn how to add to Wikidata and constructing SPARQL queries for Wikidata.
References
Luckett, K. (2009). “The relationship between knowledge structure and curriculum: a case study in sociology”. Studies in Higher Education. 34 (4): 441–453. doi:10.1080/03075070902772018. ISSN 0307-5079.
I put on my learning technologist cycle helmet and went to work for ALT. For three month, I re-entered the minority world’s Information Superhighway (Thanks, Al) / the Networked Society (hey Manny) / the Fourth Industrial Revolution (ja, Klaus) . Whatever metaphor we choose to adopt today, I occupied the role of professional development for three months (two days a week). Thanks to Maren and Kerry for the opportunity. I’m very sorry, I could not stay in the saddle or ride properly.
But…I had to leave the UK bike lane. Feet out the pedals and back on the ground….South African red earth, local communities. Interruptions, flaky Wifi, changing systems, rolling black-outs, water throttling. That is my situatedness, and my relationship with the UK and South Africa is framed both by my subjectivities and a daily reality.
I was very disappointed not to be riding for team ALT. Felt that I was letting down a great group doing good things. And (I confess) a bit relieved. The bikes in that UK lane were speeding along, and I felt I was slowing things down. Not up to speed? Unused to the terrain. Or caught up in different infrastructures, architectures, and alternate ideologies.
I didn’t know enough about the failing ground I was travelling through. Felt wobbly. Unable to navigate the traffic circles or keep up with the pack. Honestly, I’m still trying to work it out. Despite hard peddling on my part, I wasn’t able to steer my LD bike through all the other vehicles. Not ALT’s fault. Maybe not mine either?
A typology is a system of classification or the division of things according to type. It’s used for organising things according to similar or dissimilar characteristics.”
“Ensh….ication” is a concept that Cory introduced and began to find traction (according to Google Trends) in January 2023 and was nominated the 2024 word of the year by the Australian Dictionary Macquarie. The word is used to describe the failing internet. Where platforms decay because platform owners prioritise profits before people. “Ensh….ication” is an abstract and sensorial typology. But it does not explain what is actually happening, namely, the capture of material or immaterial structures and extraction. Which has been standard operating procedure for years.
The outsourcing of knowledge production to algorithms is making the net a bleak place. @karenraycosta once tweeted that “trauma can be defined as “too much, too fast”. And while at ALT, I felt that burn of anxiety in my body every day. Building up speed and keeping your balance (when the terrain seems full of potholes) is difficult. Others, riding along the same UK road, made it look easy. I noticed how the pervasive use of technology in teaching and learning had introduced a certain reflexivity about digital designs. Especially among those in the UK who have chosen to critically confront and question the assumptions, beliefs, and judgment systems that once informed their craft when serving a smaller audience.
Some of us have had a light bulb moment, where we become aware of our own position on the global ed tech cycle track. Here in South Africa, I would say we are both ahead and behind. The enshittification you notice online, has its physical manifestation here in Joburg and accross the country In my connected world with my horribly overstretched presence. It feels like I’m on too many cycle lanes and different routes, being shown to a cyclist who was used to creating rough tracks in an unknown county.
When working at ALT, Xwitter was teetering. As a South African who knew the Pretoria Boys typology I advised (to anyone who listened), that it was time to leave the platform. Path dependency can be a real pain, and many people did not want to change their routes. Since my short shift at ALT, I have been cycling with an other bunch of ed techies. Looking for new, but local, routes to ride on. Got seriously interested in the Wikimedia lane. It’s pretty much volunteer work, but for those scholars who want to boost their profile, (and shift away from Google). I can’t think of a better way of creating learning student centred learning experiences, for us to make our own pathways. Can assist if you like.
My goal on Wikimedia is to design comprehensively in multiple languages. I’m looking to meet the individual needs and abilities of the target group or individual. My Wikipedia learning design’s are supported by both good pedagogy and daily lived experiences. I don’t try and separate education from contextual realities. But see interruptions, flaky Wifi, changing systems, rolling black-outs, water throttling …. integral part of the terrain and the modernity track.
I am a bilingual South African. My languages are limited to English and Afrikaans. But much like John Amos Comenius, who saw a need to do things differently in education. I still think that we can build something better. I call it spectacular vernacular. I still am happpy to cycle with others. But we need to be aware of all conditions.
References
Thanks to Johannesburg Contemporary Art Foundation and their “World Making” series. My thoughts about situatedness, infrastructures and typologies were stimulated by their recent exhibition and accompanying guide published in 2025.
I’m ambivalent about working from home. It’s precarious not having a regular salary and unpredictable, especially with no long-term contracts. We are not a trust fund couple. The choices we have made have been possible because of textbook royalties. Unlike many fathers, I’ve also had the privilege of watching my children grow up and being a greater part of their life journey—a privilege that many fathers don’t share. But you do get to work in a garage or a freezing outside shed.
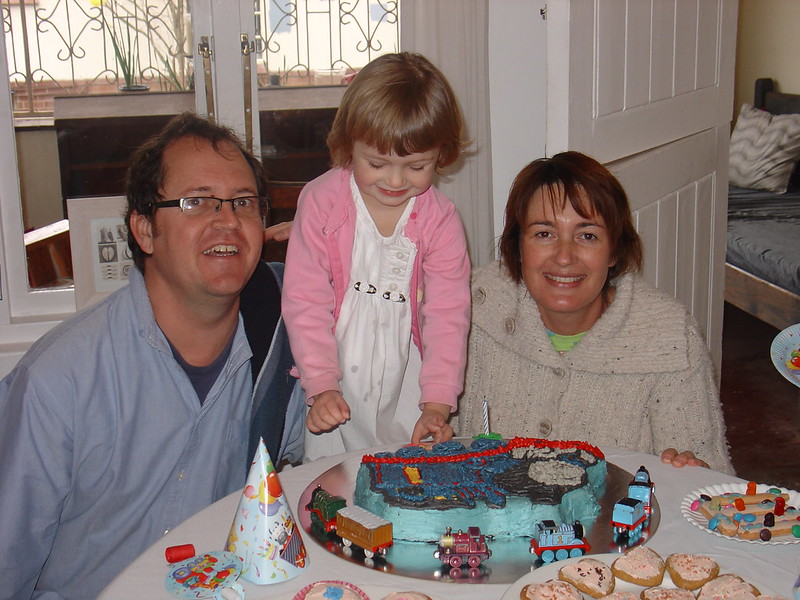
After Jean and I returned from teaching in Slough and Eton CE School in 2002, we knew that a family was the next step. Weblearning was still getting started in Pietermaritzburg, but we decided that we wanted to focus on children. In June 2005, along came Anna (two weeks late). I got to spend 5 precious years (June 2005 to June 2010) co-parenting with Jean, watching this little girl grow up. They were precious times and Flickr is probably the best place to see a few of these lovely moments. Below are birthday photos from ages 2-5
Second birthday 2007Third birthday 2008Fourth birthday 20095th Birthday 2010
Economic realities also took their toll. The 2008 financial crisis, higher education “transformation”, MOOCs and Twitter offered both challenges and opportunities. When Anna turned 5, I took the plunge and landed up at Wits, in the elearning support and innovationo (eLSI) unit trying to make a go of ed technology in higher education.
June 2010 to Nov 2015 were salaried. The decision to return back to consulting wasn’t much of a choice. If you want to see what’s really important to me. It’s not the ed tech profession (although it does consume much of my time). It’s these three immediate people and my trusted family and friends. Here’s Anna and her 11th Birthday.
11 the Birthday
Yesterday Anna turned 20, and economics is again taking its toll. It’s probably time to re-enter the marketplace. If you do know of anyone looking for a mentor / capacity builder. Whether on Wikipedia / e/learning or scholarly communication. Please shout. I’d love to chat further.